Transform Your Data Today
Unlock actionable insights with tailored analytics solutions for your business.
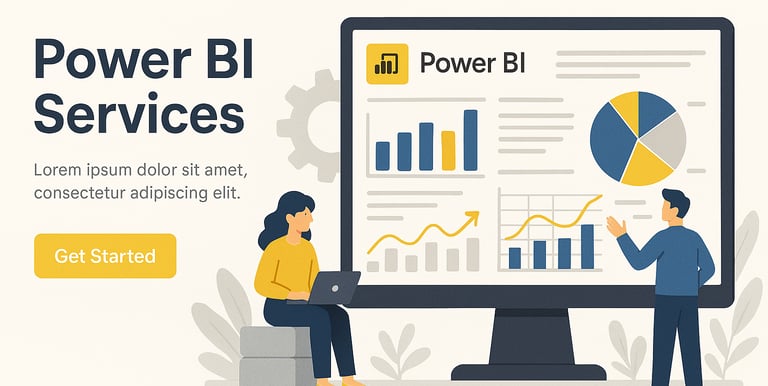
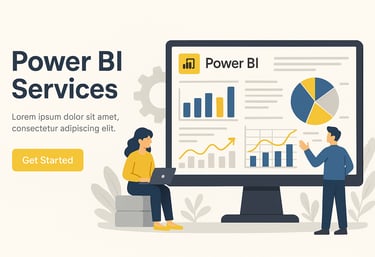
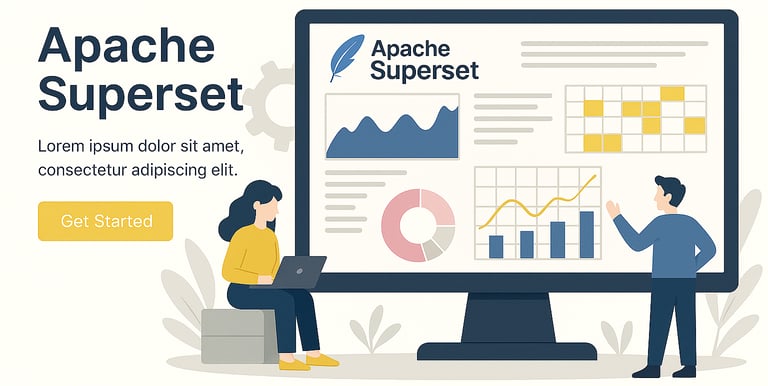
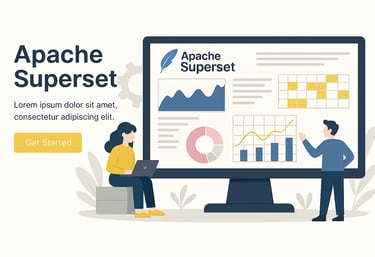
At Dashboard Service, we help small and mid-sized businesses turn raw data into clear, actionable insights using Microsoft Power BI or Apache Superset. Whether you’re just getting started with analytics or looking to improve an existing setup, our team provides end-to-end implementation, customization, and support — so you can make smarter decisions with confidence.
Why Choose Dashboard Service?
Expert Guidance
We specialize in helping growing businesses get the most value from Power BI or Superset without the complexity or cost of enterprise-level consulting.
Every business is unique. We customize dashboards, reports, and data models that align with your goals and workflows — not the other way around.
Your business doesn’t stand still — and neither should your data. We provide continuous improvements, fine-tuning, and training so your Power BI solution evolves as you do.
Practical, Tailored Solutions
Support & Optimization
We work alongside your team to ensure seamless adoption and integration, empowering your employees to make data-driven decisions every day.
Collaborative Approach
Clear Insights. Smarter Business.
Transform raw data into actionable insights with our expert Power BI and Apache Superset solutions.
What Gets Measured,
Gets Managed.
Your Business.
Your Dashboard.
Subscribe for Insights
Unlock your data's potential with our expertise.
Dashboard Service transformed our data into actionable insights, making decision-making much easier.
John D.


★★★★★
Dashboard Service
12318 N Austin Shore Dr, Cypress, Texas 77433
Phone
info@dashboardservice.com
+1-713-805-4108
© 2025. All rights reserved.
Address